clarite.plot.top_results
-
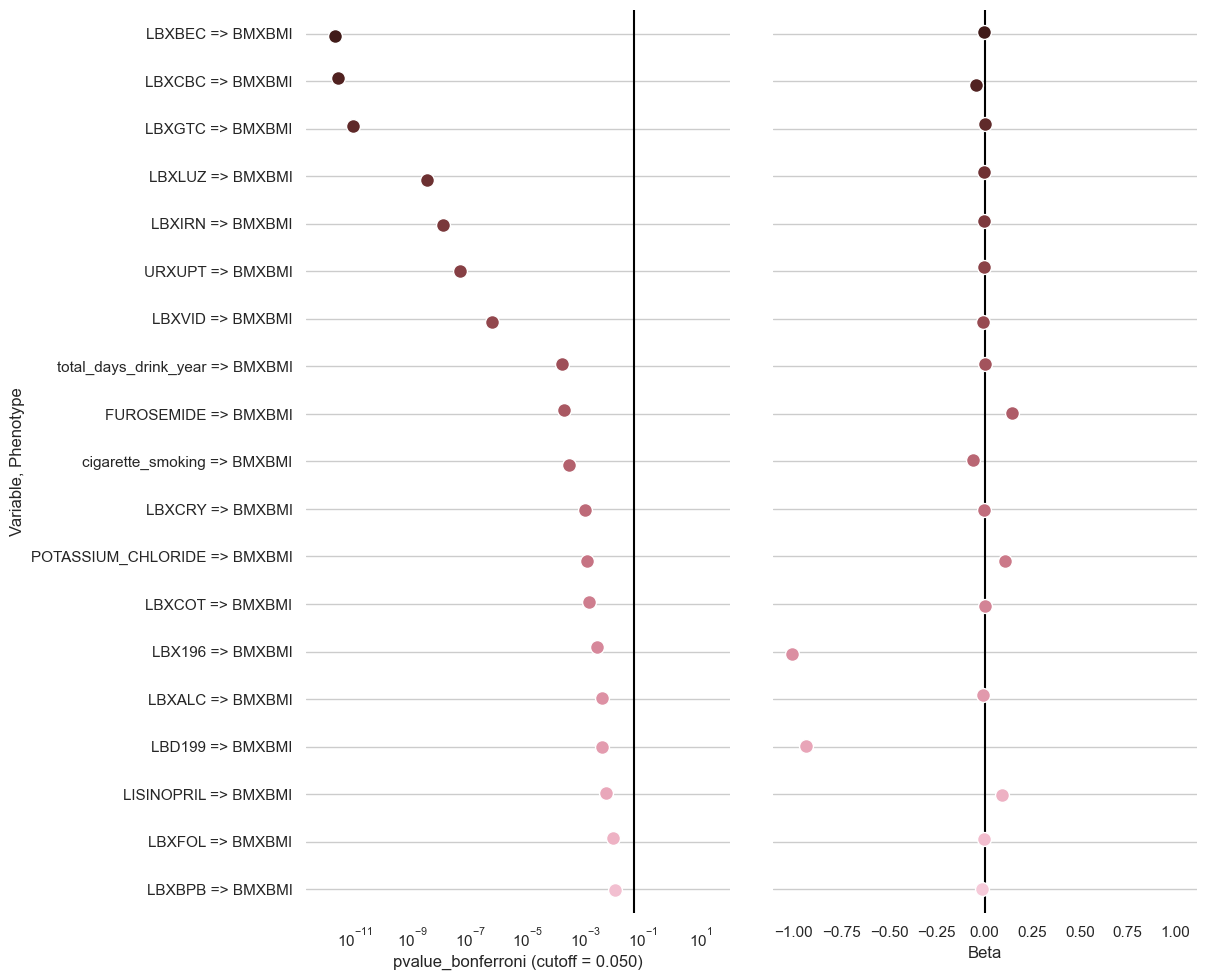
clarite.plot.top_results(ewas_result: pandas.core.frame.DataFrame, pvalue_name: str = 'pvalue', cutoff: float = 0.05, num_rows: int = 20, filename: Union[str, NoneType] = None)¶ Create a dotplot for EWAS Results showing pvalues and beta coefficients
Parameters: - ewas_result: DataFrame
EWAS Result to plot
- pvalue_name: str
‘pvalue’, ‘pvalue_fdr’, or ‘pvalue_bonferroni’
- cutoff: float (default 0.05)
A vertical line is drawn in the pvalue column to show a significance cutoff
- num_rows: int (default 20)
How many rows to show in the plot
- filename: Optional str
If provided, a copy of the plot will be saved to the specified file
Returns: - None
Examples
>>> clarite.plot.top_results(ewas_result)