clarite.plot.histogram
-
clarite.plot.histogram(data, column: str, figsize: Tuple[int, int] = (12, 5), title: Union[str, NoneType] = None, figure: Union[figure, NoneType] = None, **kwargs)¶ Plot a histogram of the values in the given column. Takes kwargs for seaborn’s distplot.
Parameters: - data: pd.DataFrame
The DataFrame containing data to be plotted
- column: string
The name of the column that will be plotted
- figsize: tuple(int, int), default (12, 5)
The figure size of the resulting plot
- title: string or None, default None
The title used for the plot
- figure: matplotlib Figure or None, default None
Pass in an existing figure to plot to that instead of creating a new one (ignoring figsize)
- **kwargs:
Other keyword arguments to pass to the distplot function of Seaborn
Returns: - None
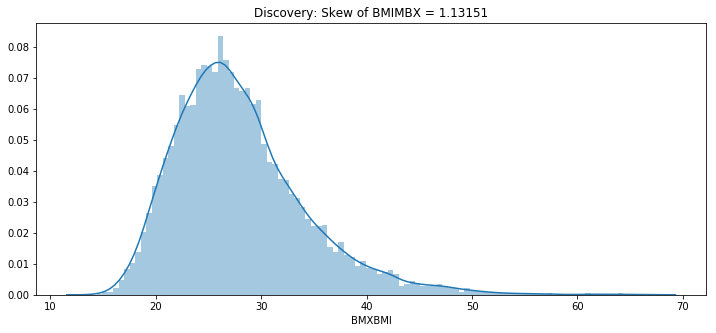
Examples
>>> import clarite
>>> title = f"Discovery: Skew of BMIMBX = {stats.skew(nhanes_discovery_cont['BMXBMI']):.6}"
>>> clarite.plot.histogram(nhanes_discovery_cont, column="BMXBMI", title=title, bins=100)