clarite.plot.top_results
-
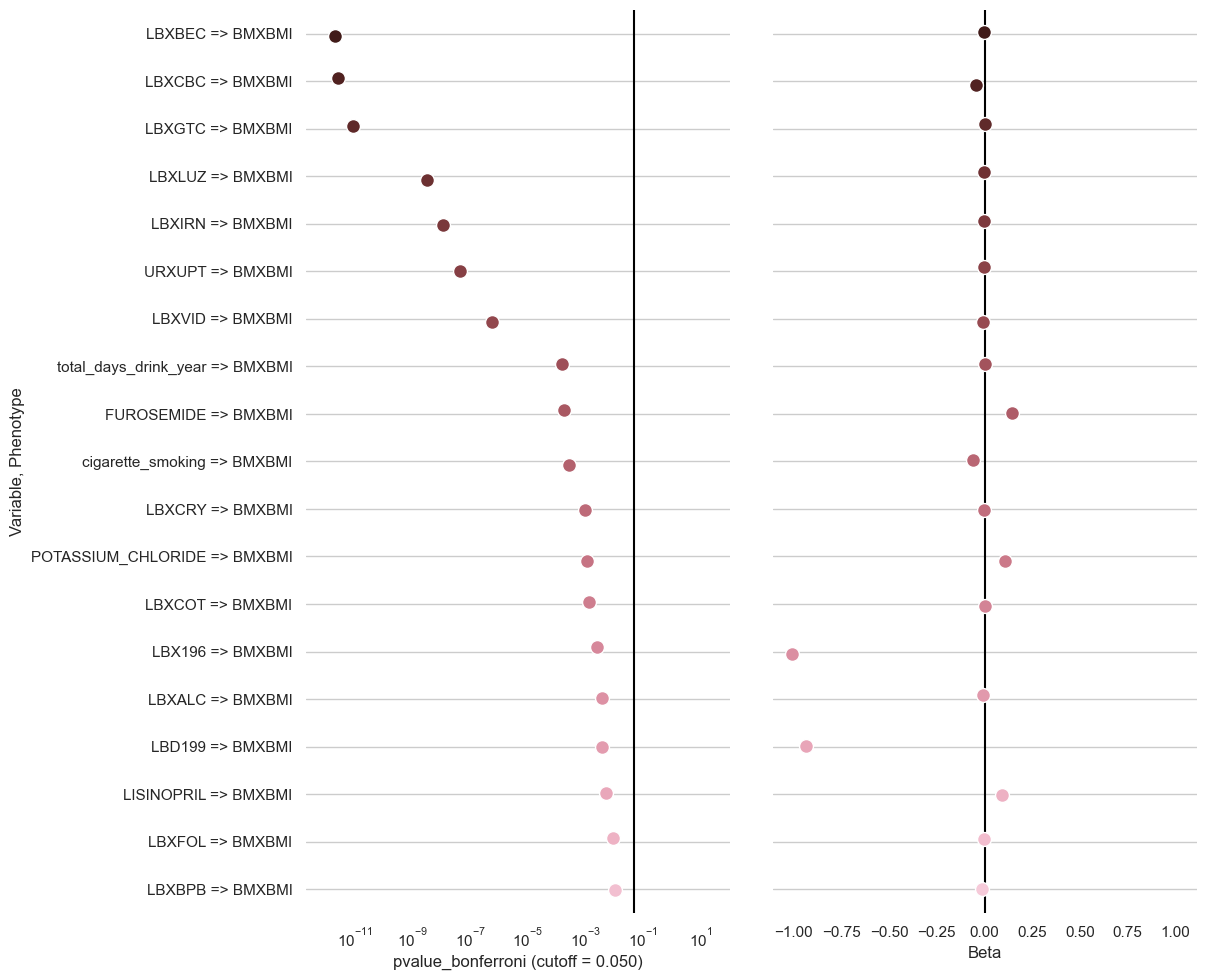
clarite.plot.top_results(ewas_result: pandas.core.frame.DataFrame, pvalue_name: str = 'pvalue', cutoff: Optional[float] = 0.05, num_rows: int = 20, figsize: Optional[Tuple[int, int]] = None, dpi: int = 300, title: Optional[str] = None, figure: Optional[matplotlib.pyplot.figure] = None, filename: Optional[str] = None)¶ Create a dotplot for EWAS Results showing pvalues and beta coefficients
Parameters: - ewas_result: DataFrame
EWAS Result to plot
- pvalue_name: str
‘pvalue’, ‘pvalue_fdr’, or ‘pvalue_bonferroni’
- cutoff: float (default 0.05)
A vertical line is drawn in the pvalue column to show a significance cutoff
- num_rows: int (default 20)
How many rows to show in the plot
- figsize: tuple(int, int), default (12, 6)
The figure size of the resulting plot in inches
- dpi: int, default 300
The figure dots-per-inch
- title: string or None, default None
The title used for the plot
- figure: matplotlib Figure or None, default None
Pass in an existing figure to plot to that instead of creating a new one (ignoring figsize and dpi)
- filename: Optional str
If provided, a copy of the plot will be saved to the specified file instead of being shown
Returns: - None
Examples
>>> clarite.plot.top_results(ewas_result)