clarite.plot.distributions
-
clarite.plot.distributions(data, filename: str, continuous_kind: str = 'count', nrows: int = 4, ncols: int = 3, quality: str = 'medium', variables: Optional[List[str]] = None, sort: bool = True)¶ Create a pdf containing histograms for each binary or categorical variable, and one of several types of plots for each continuous variable.
Parameters: - data: pd.DataFrame
The DataFrame containing data to be plotted
- filename: string or pathlib.Path
Name of the saved pdf file. The extension will be added automatically if it was not included.
- continuous_kind: string
What kind of plots to use for continuous data. Binary and Categorical variables will always be shown with histograms. One of {‘count’, ‘box’, ‘violin’, ‘qq’}
- nrows: int (default=4)
Number of rows per page
- ncols: int (default=3)
Number of columns per page
- quality: ‘low’, ‘medium’, or ‘high’
Adjusts the DPI of the plots (150, 300, or 1200)
- variables: List[str] or None
Which variables to plot. If None, all variables are plotted.
- sort: Boolean (default=True)
Whether or not to sort variable names
Returns: - None
Examples
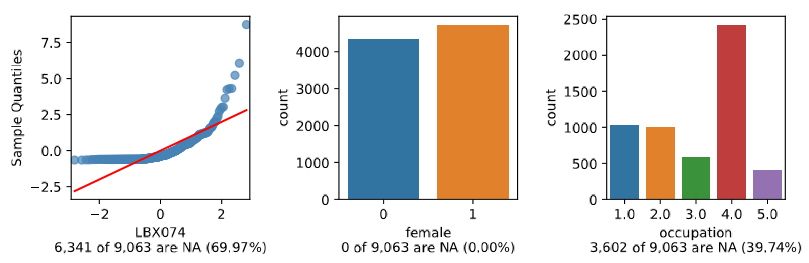
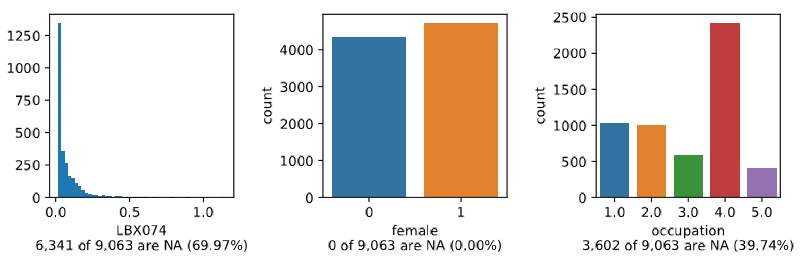
>>> import clarite
>>> clarite.plot.distributions(df[['female', 'occupation', 'LBX074']], filename="test")
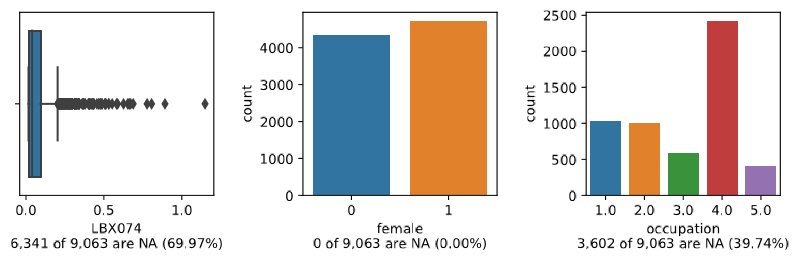
>>> clarite.plot.distributions(df[['female', 'occupation', 'LBX074']], filename="test", continuous_kind='box')
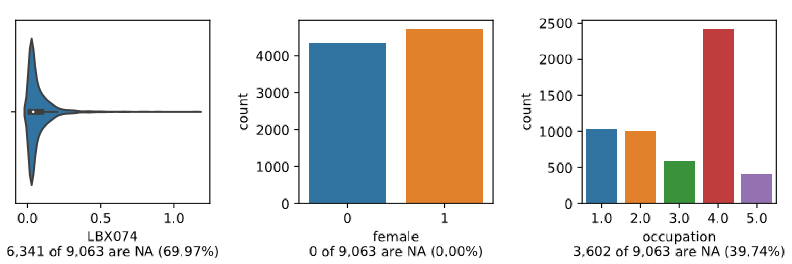
>>> clarite.plot.distributions(df[['female', 'occupation', 'LBX074']], filename="test", continuous_kind='violin')
>>> clarite.plot.distributions(df[['female', 'occupation', 'LBX074']], filename="test", continuous_kind='qq')