clarite.plot.manhattan_bonferroni
-
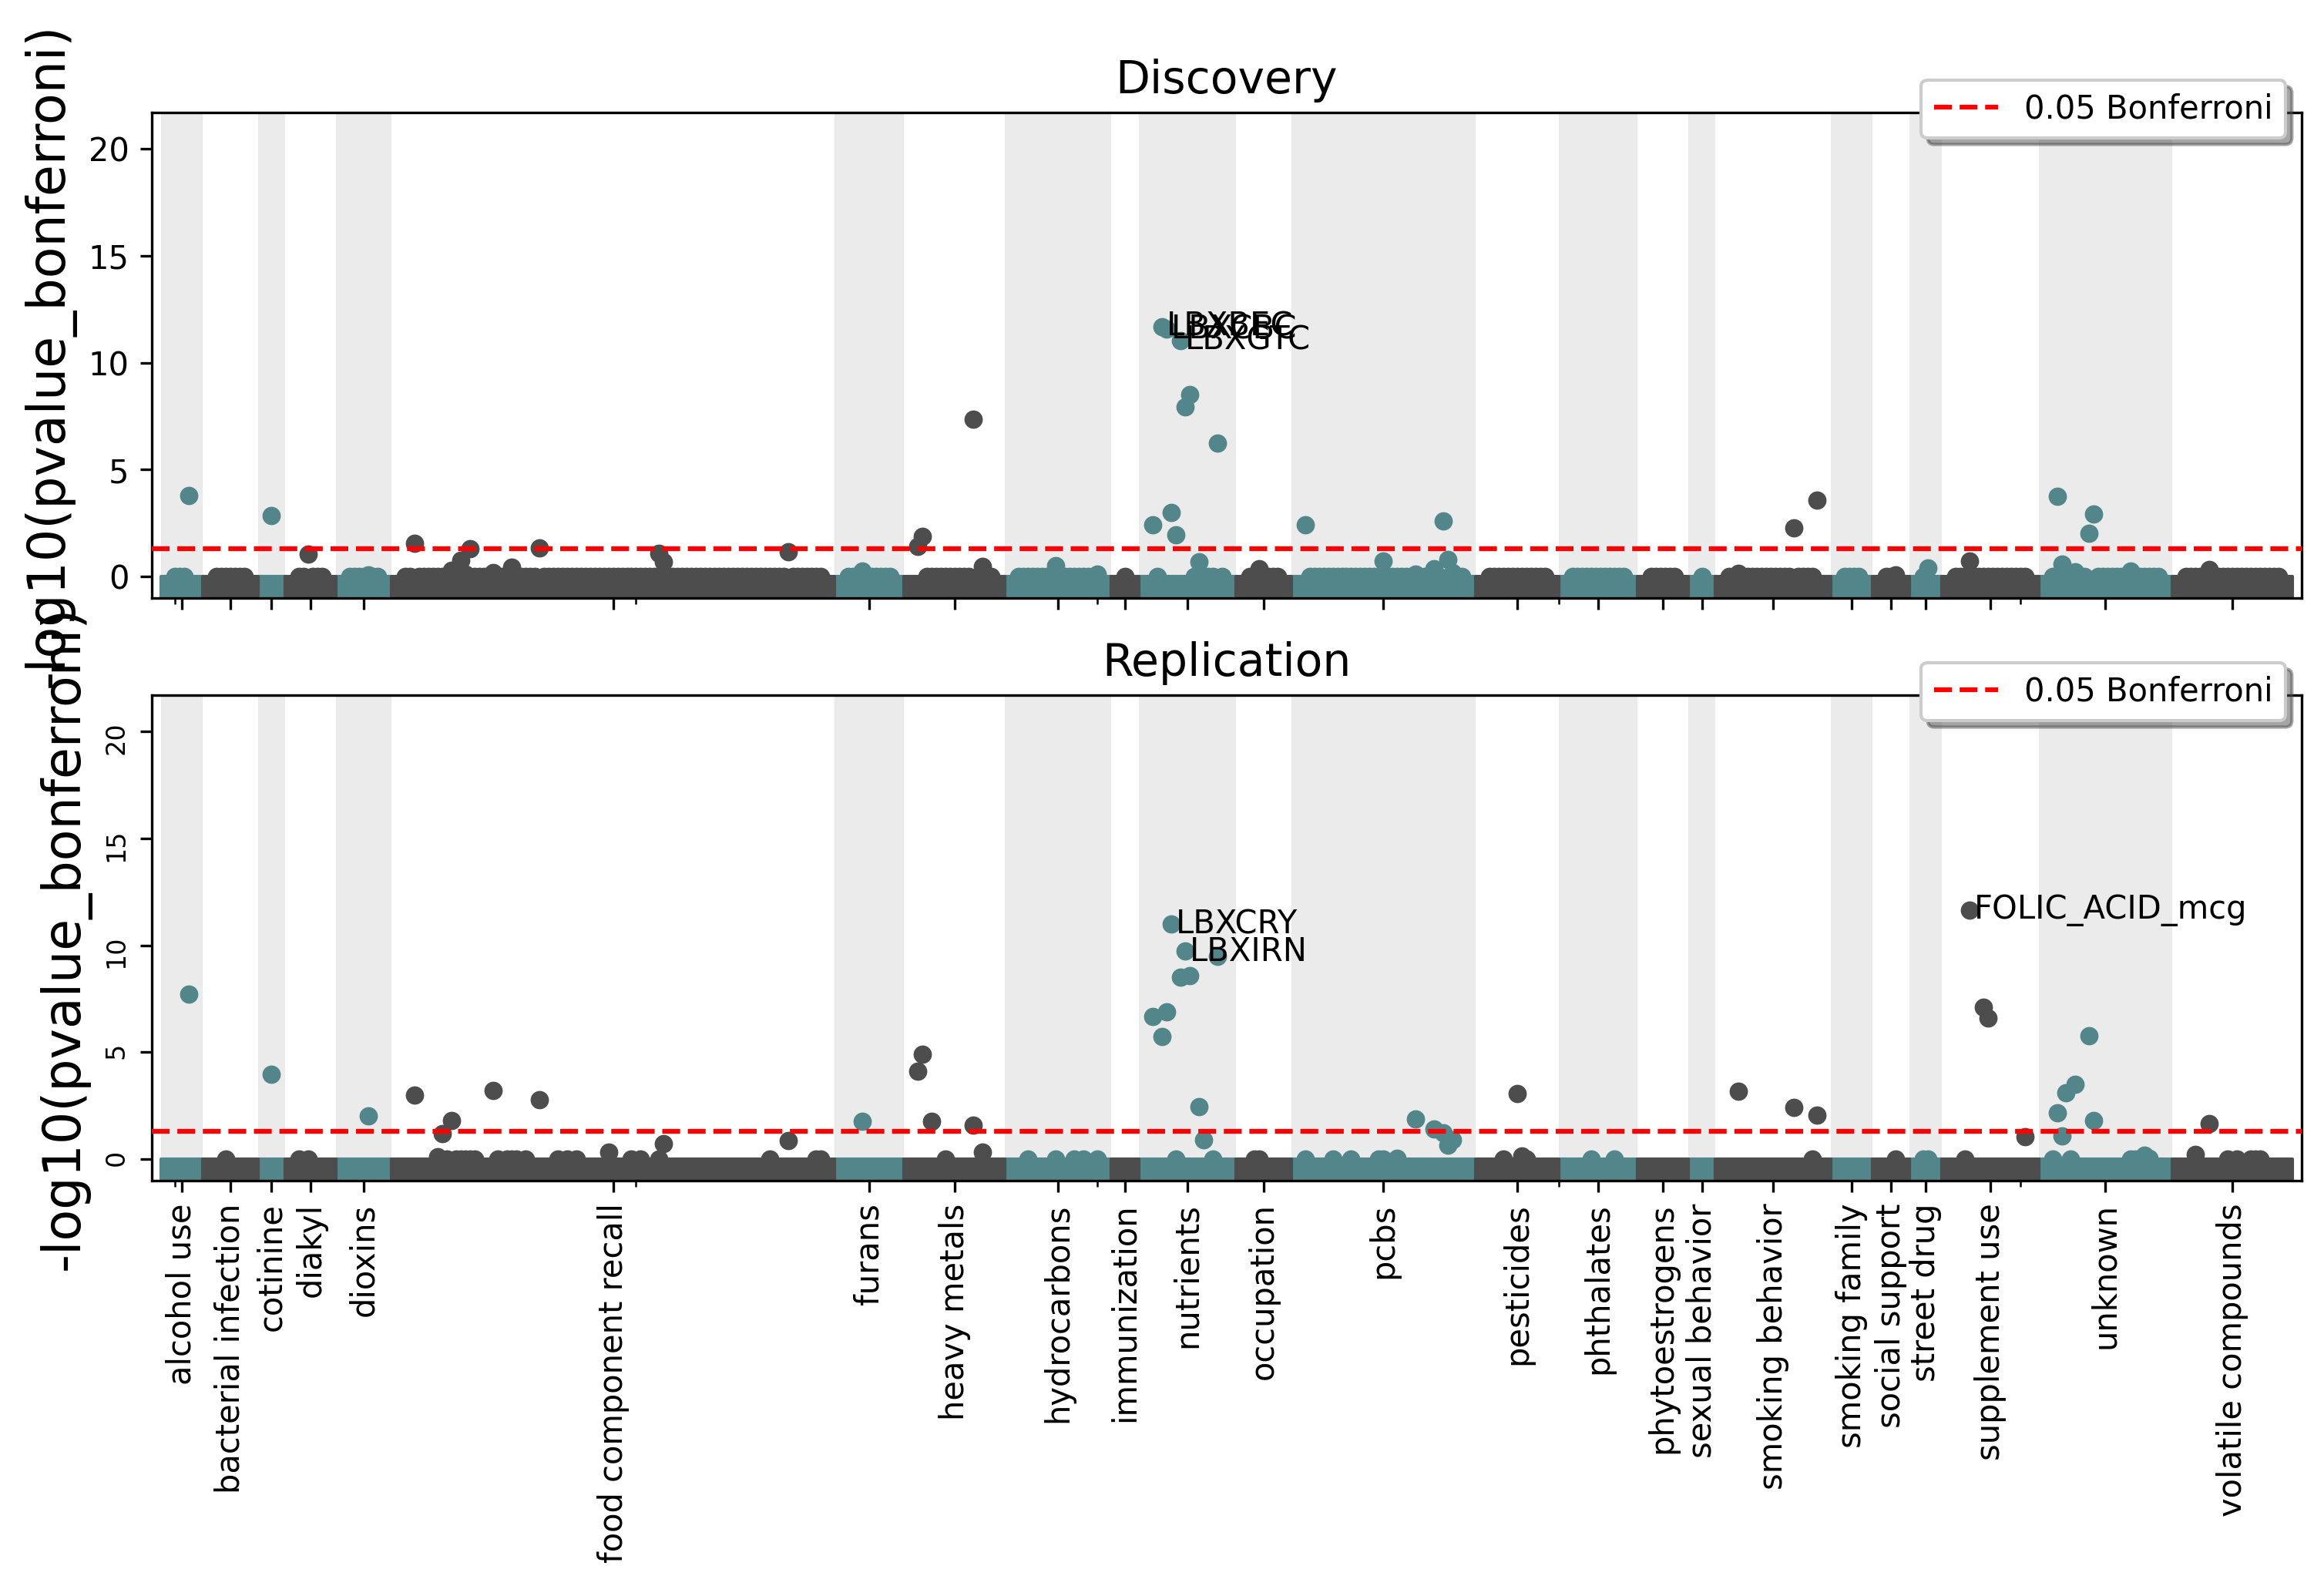
clarite.plot.manhattan_bonferroni(dfs: Dict[str, pandas.core.frame.DataFrame], categories: Optional[Dict[str, str]] = None, cutoff: Optional[float] = 0.05, num_labeled: int = 3, label_vars: Optional[List[str]] = None, figsize: Tuple[int, int] = (12, 6), dpi: int = 300, title: Optional[str] = None, figure: Optional[matplotlib.pyplot.figure] = None, colors: List[str] = ['#53868B', '#4D4D4D'], background_colors: List[str] = ['#EBEBEB', '#FFFFFF'], filename: Optional[str] = None, return_figure: bool = False)¶ Create a Manhattan-like plot for a list of EWAS Results using Bonferroni significance
Parameters: - dfs: DataFrame
Dictionary of dataset names to pandas dataframes of ewas results (requires certain columns)
- categories: dictionary (string: string) or None
A dictionary mapping each variable name to a category name for optional grouping
- cutoff: float or None (default 0.05)
The pvalue to draw the Bonferroni significance line at (None for no line)
- num_labeled: int, default 3
Label the top <num_labeled> results with the variable name
- label_vars: list of strings, default None
Label the named variables (or pass None to skip labeling this way)
- figsize: tuple(int, int), default (12, 6)
The figure size of the resulting plot in inches
- dpi: int, default 300
The figure dots-per-inch
- title: string or None, default None
The title used for the plot
- figure: matplotlib Figure or None, default None
Pass in an existing figure to plot to that instead of creating a new one (ignoring figsize and dpi)
- colors: List(string, string), default [“#53868B”, “#4D4D4D”]
A list of colors to use for alternating categories (must be same length as ‘background_colors’)
- background_colors: List(string, string), default [“#EBEBEB”, “#FFFFFF”]
A list of background colors to use for alternating categories (must be same length as ‘colors’)
- filename: Optional str
If provided, a copy of the plot will be saved to the specified file instead of being shown
- return_figure: boolean, default False
If True, return figure instead of showing or saving the plot. Useful to customize the plot
Returns: - figure: matplotlib Figure or None
If return_figure, returns a matplotlib Figure object. Else returns None
Examples
>>> clarite.plot.manhattan_bonferroni({'discovery':disc_df, 'replication':repl_df},
 categories=data_categories, title="EWAS Results")